18
Tracking Instagram Performance – A Brief Overview
In recent years, Instagram has transformed into a useful platform for many business owners and professionals.
Beginning early 2021, Instagram added a Professional Dashboard, allowing all professional accounts (business and creator) to access account performance data. With this new feature added to the platform, business owners are able to achieve their social media goals in relation to their business growth.
If you are struggling with understanding what everything means in your Instagram Professional Dashboard keep reading for a quick tutorial!
What is the Professional Dashboard?
The Professional Dashboard gives businesses the tools that they need to track account performance, access, discover professional tools, and explore educational information. With the promise of streamlining your administrative tasks, Instagram’s Professional Dashboard gives you an easy-to-access dashboard to house all of the necessary Instagram tools.
The Dashboard will allow you to review insights and trends based on your account’s performance. It will also allow you to efficiently access tools to run your account, discover new tools to help grow your business and check monetization status and eligibility.
With the dashboard, you can also learn how to make the most of Instagram through curated educational resources that include tips, tricks, guidance, and content inspiration.
This tool allows business owners and creators to use Instagram as a backbone to their business strategy. Instead of chasing down data and metrics, everything is easily accessible for you to review in one spot.
Understanding your Account Performance and Data
The biggest selling point to having your business be on Instagram is the built-in metrics and data. Typically, businesses must manually track their information or rely on a third party to provide this information. With Instagram, you have everything from your account performance to the breakdown of your audience right at the tip of your fingers.
When you open your Professional Dashboard, you will immediately see your performance over the last 30 days. This will give you a general overview of how many accounts you reached. Above your chart, there will be a section for Account Insights. Let’s go ahead and take a deeper dive into what kind of data you will have available through the dashboard.
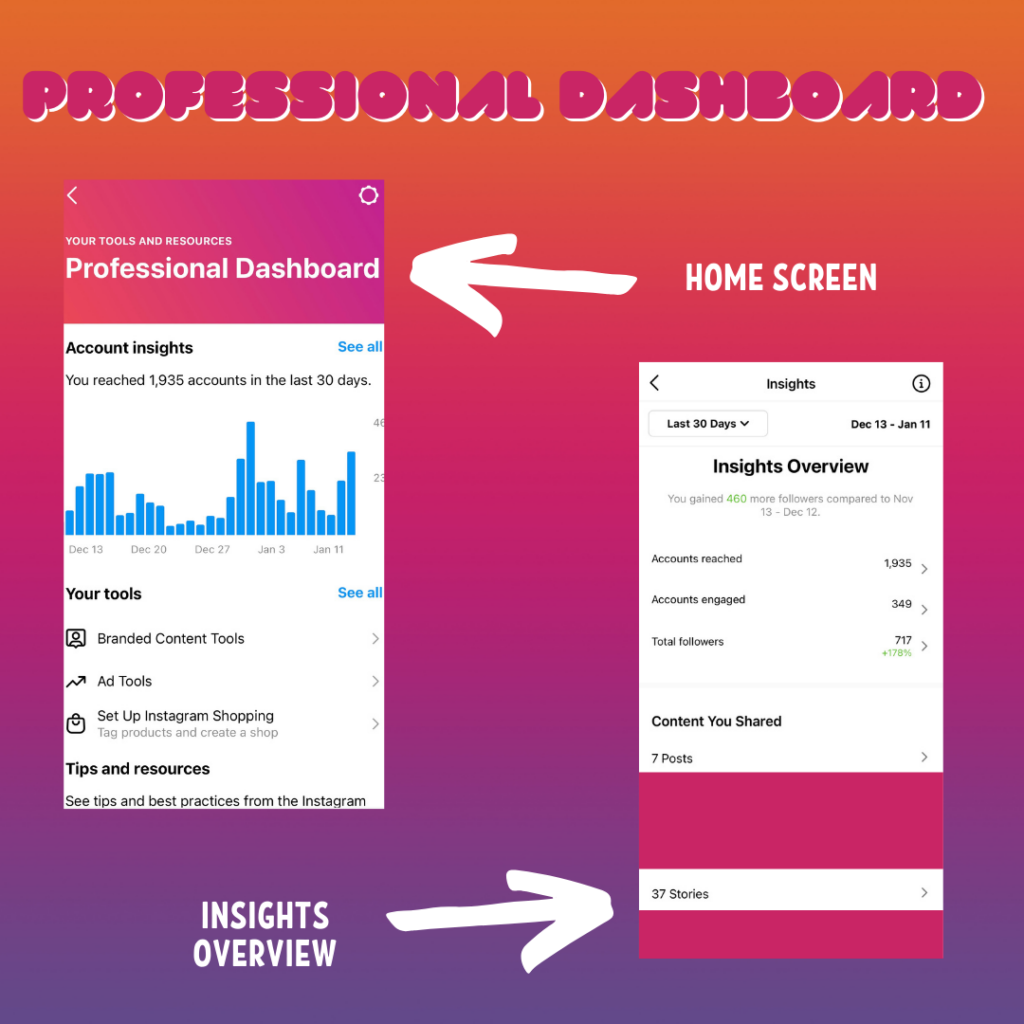
The first thing on your Insights page is your data range. You can view the data from the last 7 days, 14 days, 30 days, 90 days, or the previous month. You can also view a custom date range.
On your Insights Overview page, there is a breakdown of your data by Accounts Reached, Accounts Engaged, and Total Followers. In the following sections, you will see the different types of content you have shared during the selected date range.
Accounts Reached
Accounts Reached displays the information on the accounts that you have reached through organic content and paid promotions. The data is created through analysis of the specific demographics of your audience.
It is broken down by top cities, top countries, top age ranges, and gender. You can also see how your content reach is performing by followers versus non-followers.
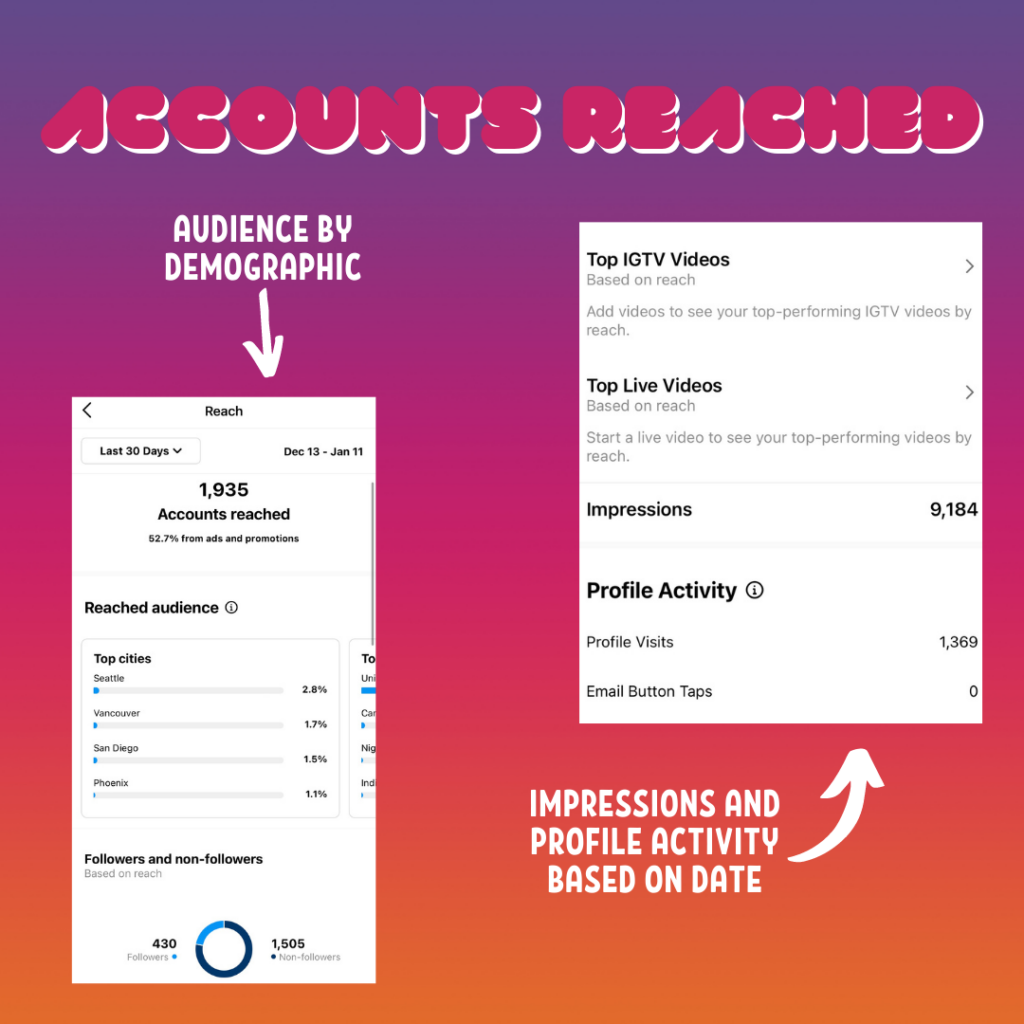
Moving down the page you will see your top pieces of content, including posts, stories, reels, IGTV videos, and live videos. It will display the number of people reached per that piece of content, whether the content was boosted, and when it was posted.
At the very bottom, you will see the total number of impressions for your entire profile for the specified date range as well as how many profile visits and email button taps you received.
Accounts Engaged
Engagement is very different from reach. This metric shows how your audience engaged with your content, such as liking it, commenting, sharing, and such. As in the Accounts Reached section, you can select the date range. You are also able to review whether your engagement performance primarily comes from your followers or non-followers.
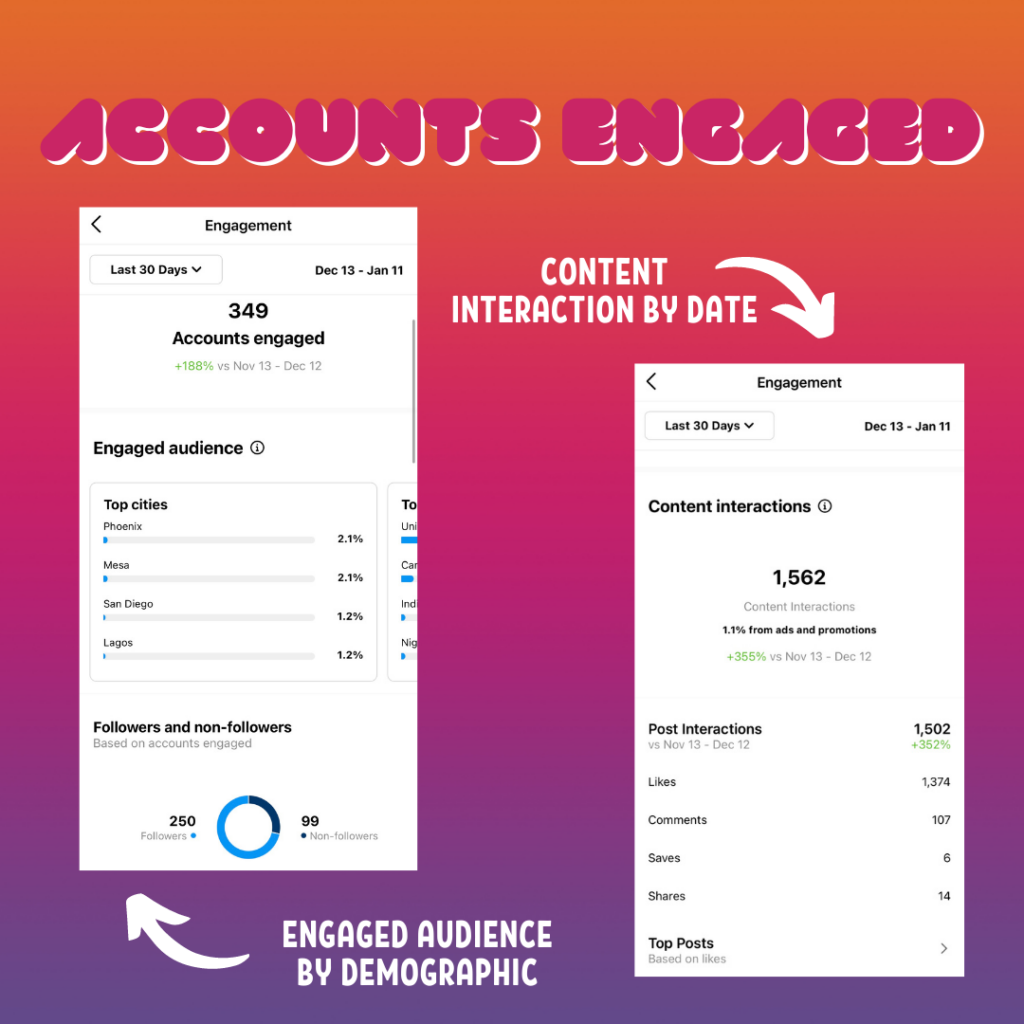
The major difference between the Reached and Engaged dashboards is within Engaged – there is a section called Content Interactions. Within this portion of the dashboard, you can see how many interactions you received for your selected date range. It is broken down into four categories (Likes, Comments, Saves, and Shares). You can also see a general overview of how each individual piece of content performed based on specific interactions.
Total Followers
This section is a complete overview of your Followers. I would like to note that this section has nothing to do with engagement or reach and just simply highlights your follower data.
Just like all the other sections, you can filter this one by date range. From here you will see how many followers you gained and lost during that time. You can even see what your overall growth was on any given day by simply selecting a day on the graph provided by Instagram.
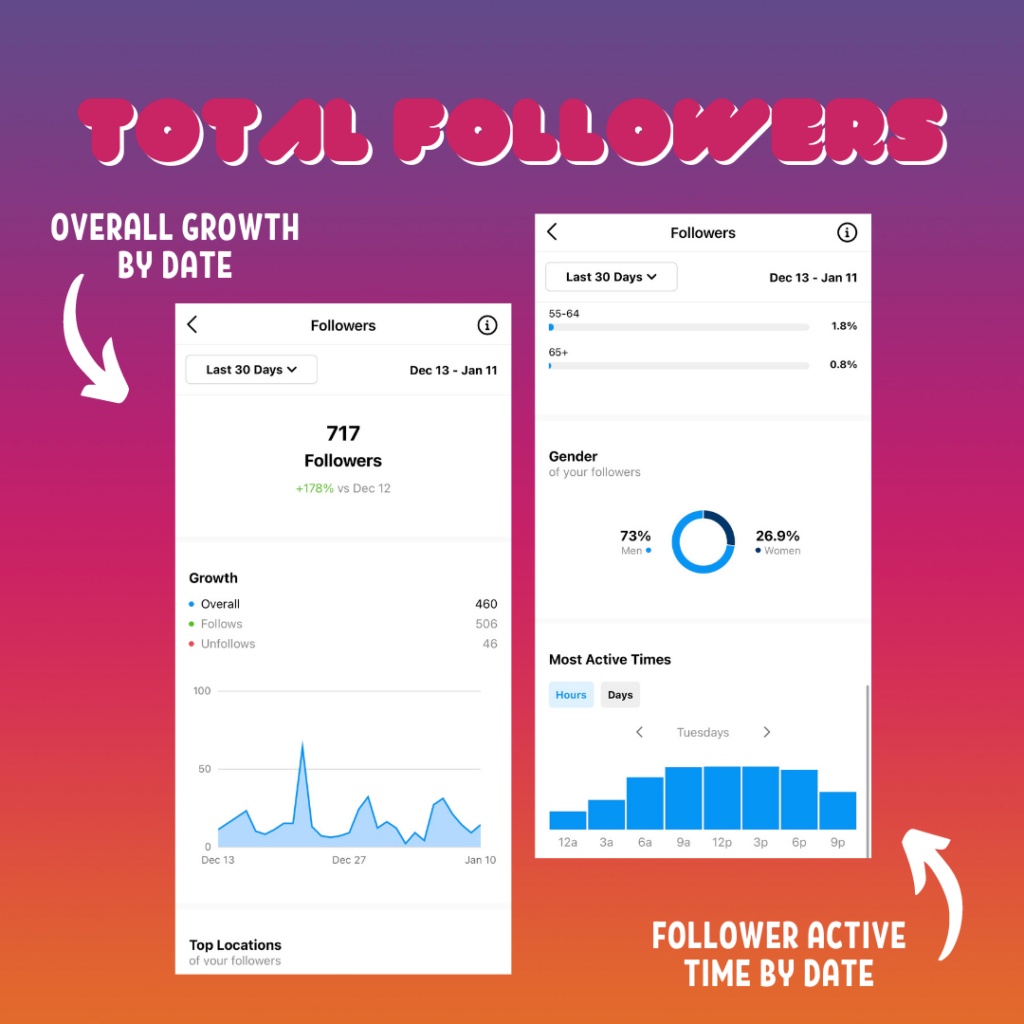
Below the graph, you will find additional followers demographic info including top location by cities and countries, age range overall as well as age range by gender, and the gender breakdown of your followers.
The last info in this section is called Most Active Times. This is one of the coolest features within the Professional Dashboard as you get insight into when your followers are the most active by day and within what frame. You can utilize this feature to post at the most appropriate times.
Using Data to Inform Decisions
The existing data provided by Instagram offers your practice a resource for shaping the types of posts and frequency of posting you undertake. We strongly recommend using the available data to inform your posting decisions!
For information on using the tools Instagram offers, we invite you to check out this blog post.
As always, if you have any questions pertaining to Instagram or social media in general please feel free to reach out to us!
—Marie Dubray, Social Media Specialist, Sesame Communications