17
Understanding Your Search Report
With our SEO and Social Services, you get monthly reports that go over how your website and social platforms are performing. You can see how your results have improved month-over-month, see what website pages are the most visited, as well as determine the ROI for your different paid campaigns.
You can always reach out to our teams to review your report. Use this blog post as a resource to understand the details of your search report.
What is Covered in Your Report?
Depending on the services that you have with Sesame, the following data is provided in your monthly report:
- Sesame First Call Data
- Website Data
- Sesame SEO Data
- Sesame Social Data
- Pay-Per-Click Data
- Social Media Advertising Data
Let’s take a closer look at exactly what data you will be seeing in your reports.
Sesame First Call
Sesame First Call is a tracking system that identifies the online marketing strategy that is most successful in generating the first call from a potential patient.
With this report, you are shown data on calls from organic sources versus calls from paid traffic. This can help you understand whether you are bringing in more patients from our marketing efforts or if patients are finding you organically.
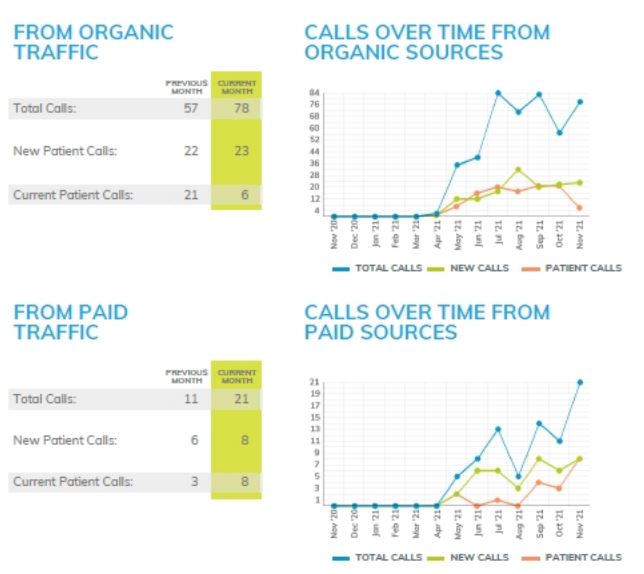
We will provide you with the month’s data compared to the previous month so you can see how your data over time. You will also be provided with graphs to see the change over the past year. This graph is broken down by the total number of calls that you have received and how many of those were new patient calls and how many were returning patients.
We suggest that you get at least 4 months of First Call data to really see how it impacts the number of new patients that you will receive through the service.
Website Data
Our website section provides you with data on the number of patients visiting your website and what actions they are taking during the visit.
With this data, you can see the traffic by location and a breakdown of where your patients are searching for your practice. This can be incredibly useful if you are looking into paid advertising. You’re also able to see the number of visits to your website over the last year, and the top pages that are being viewed.
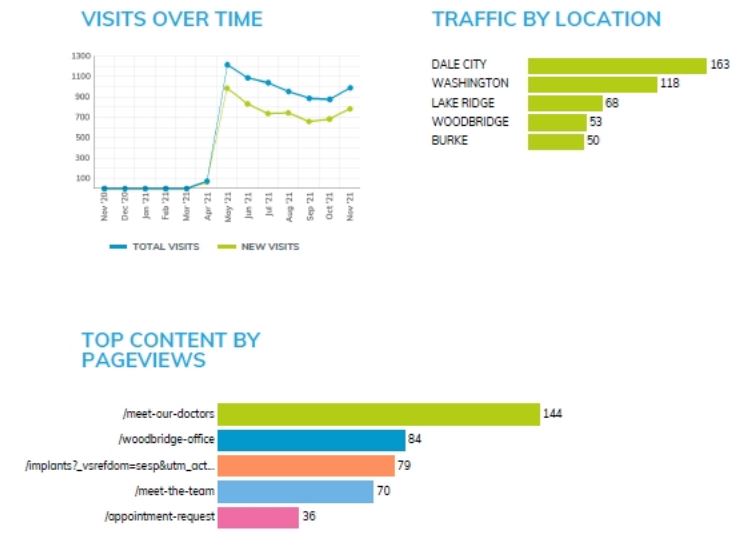
Your traffic and top pages data will only be shown month-by-month. To see this data over time you will need to open each report.
Sesame SEO
Sesame SEO focuses on how patients arrive at your website through organic, referral, and direct searches. Organic traffic is visitors that come to your website unpaid from a search engine. Direct traffic means your patient types your URL directly into their search bar or visits through a bookmark. Referral traffic comes from a site that directs visitors to your page like through Facebook or a local website that you are listed on.
The SEO section shows a few different key data points. The first one is overall traffic. This breaks down the types of visits you receive. You can find the total visits per month as well as the average daily visits and how much time each visitor spent per month. Then it shows data from the total visits you received from each of the traffic sources as well as how many of those visits were new.
The graph to the side provides a visual overview of the total visits by traffic source so you can easily see where your traffic is coming from.
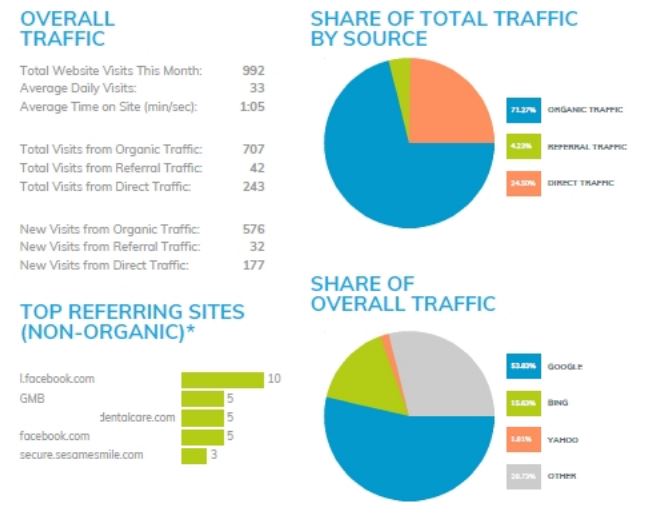
The second half of the SEO section shows the top referring sites. As we mentioned above, referral traffic clicks through to your website from another online source. In this report, you can see a breakdown of which sites are your top referrals.
Finally, you can see where your overall traffic is coming from.
Sesame Social – Facebook Data
Your Sesame Social section will be over a span of two pages. Let’s start by breaking down what is on the first page.
Through the Sesame Social service, you weekly get posts to your Facebook and Instagram. At this time, the reporting is only able to provide data on Facebook which is detailed in the first page of the Sesame Social data.
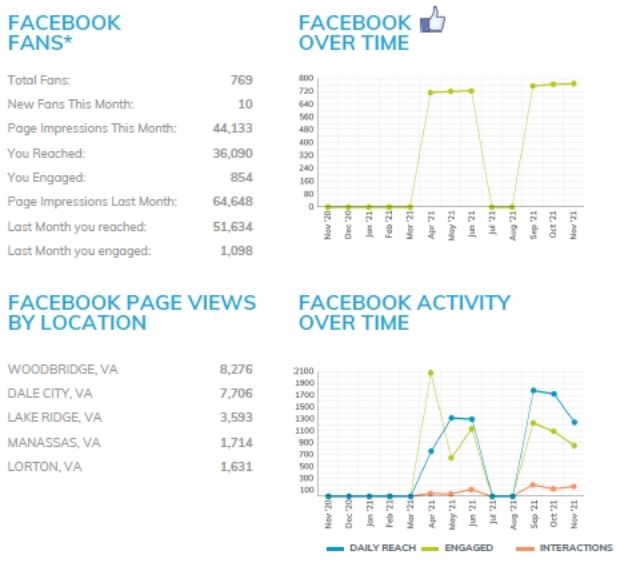
There are 4 parts to the first page, starting with an overview of Facebook Fans. This goes through how many fans you have and gain over this month as well as your Impressions, Reach, and Engagement from this month and last month. These are the most important numbers because it shows how your fans are reacting to the content that you post.
You can see a visual overview of your reach, engagement, and impressions in the graph below over the span of a year. This can help your practice understand what kind of content your fans want to see on your page.
The next section is a visual overview of your total fans over time. We want to see a steady increase here however it is normal to lose fans as well, so don’t be too worried about that.
Finally, there is a list of your page views by location. Just like in the website traffic section, you can use this data if you are looking to run paid advertising on your Facebook and Instagram accounts. We will talk more about this data towards the end of this post.
Please note that to gain access to your Facebook insights (data from Facebook) you must give us administrative access to your Facebook page as well as have a minimum of 30 likes. This means that if you are just starting your Facebook page, you may not have data right away on your reports because there are a few requirements that need to be completed first.
And of course, your Facebook data will trend higher if your practice is participating in creating and posting content on a regular basis.
Sesame Social – Blog Data
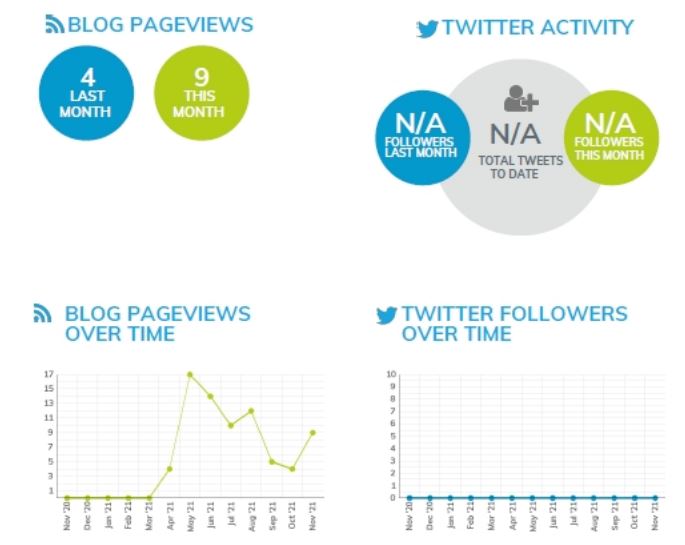
The second part of your social section will cover data on your website blog as well as Twitter if you have it connected to our social tool.
Your blog data will show the number of pageviews you have had in the current month compared to the last month. It will also show you a year preview of how your views have changed over the past year.
Sesame Pay-Per-Click
Sesame Pay-Per-Click helps target new patients through search engine ads with a monthly set budget and a call tracking number to allow you to track patient calls. This section breaks down all the numbers that you need to know for your monthly campaign.
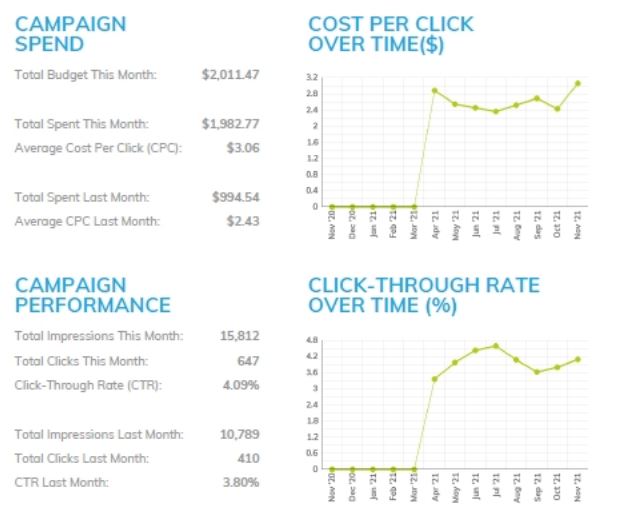
The Campaign Spend shows you an overview of your budget this month and last month versus how much was spent. It also provides you with your Average Cost-Per-Click (CPC). This number is important because it measures the price that you pay for each click of your PPC ads. This is important because you want your cost-per-click to be as low as possible as it is a good indicator that your ads are performing how they should with your audience. There is also a visual of your CPC over the span of one year. Remember, a decrease in CPC is what you want to see!
You’ll also see your campaign performance. This will include the number of total impressions, total clicks, and the click-through rate for this month and last month. The click-through-rate shows you how many clicks your ad receives. This number you want to be higher because that means that more people are clicking through to your website. Generally, you will want between a 2-5% click-through rate. Check out your graph on this page to see how your ads are performing over time. If you are noticing a decrease, reach out to your SEO team and they can help adjust your campaign to perform better.
Sesame Social Media Ads
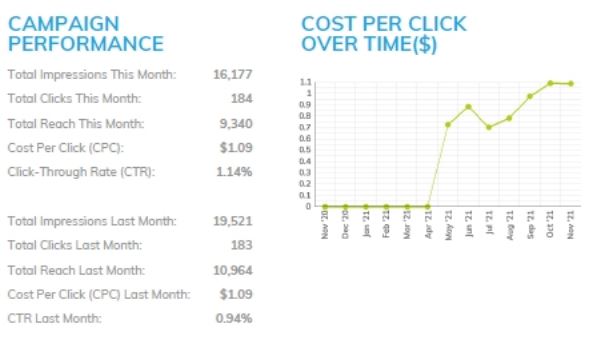
Finally, the last page of your report will be about your social media campaigns. Just like your Pay-Per-Click page, you will see data on how the campaign performed for the current month versus the previous month. You will also see the cost-per-click over time.
You will want to keep your eyes on Cost-Per-Click and Click-Through-Rate in this section again. This will help you determine how your ads are performing. However, knowing the total impressions, total clicks, and total reach can be beneficial to know as well so keep those numbers in mind too.
Remember, if you do not have all these services, you will not have data on some of these pages. However, if you do have a service and are not seeing any data, please reach out to your SEO or Social teams, depending on the service, and they can investigate the issue.
We hope that this post gave you a good idea of what to expect from your monthly search report. If you are ever looking to review the results in more detail, please schedule a call with the respective teams. However, please note that we do require at least 3 months of data before reviewing the results month-over-month and making any adjustments to the strategy.
—Marie Dubray, Social Media Specialist, Sesame Communications